Thirty-six African countries were among the 142 covered in the 2013 Global Innovation Index (GII 2013). The theme for this year's index was "The Local Dynamics of Innovation."
In its sixth edition this year, the GII 2013 is co-published by Cornell University, INSEAD (a leading graduate business school with campuses in France, Singapore and Abu Dhabi), and the World Intellectual Property Organization (WIPO), a specialized agency of the United Nations.
“Dynamic innovation hubs are multiplying around the world despite the difficult state of the global economy. These hubs leverage local advantages with a global outlook on markets and talent,” says WIPO Director General Francis Gurry. “For national-level policy makers seeking to support innovation, realizing the full potential of innovation in their own backyards is often a more promising approach than trying to emulate successful innovation models elsewhere.”
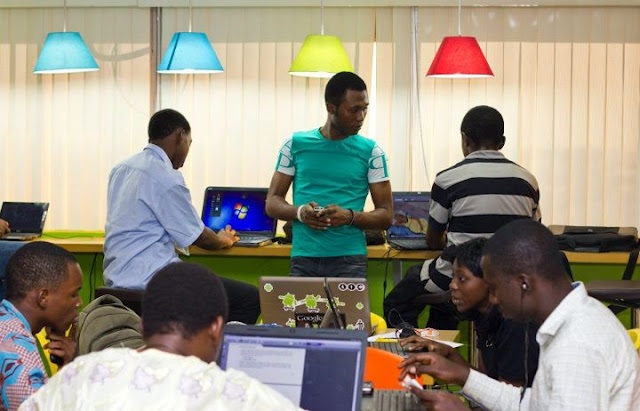
Dynamic innovation is alive and well in Africa, where more than 45 technology hubs and incubators already are harnessing local creativity. In August, Africastrictlybusiness.com created and launched FABA (For Africa By Africans), a weekly column highlighting scientific, technological, engineering, and design innovation in Africa that responds to local challenges, needs and appetites. FABA (For Africa By Africans) is featured on Wednesdays.
The GII 2013 is calculated as the average of two sub-indices: the Innovation Input Sub-Index, which gauges elements of the national economy that embody innovative activities grouped in five pillars (institutions, human capital and research, infrastructure, market sophistication, business sophistication); and the Innovation Output Sub-Index, which captures actual evidence of innovation results, divided in two pillars (knowledge and technology outputs; and creative outputs).
Of the 36 African countries covered, the top 25 are shown below. The 11 countries not shown are, in order of their Africa rank, Guinea, Benin, Ethiopia, Niger, Zimbabwe, Angola, Cote d’Ivoire, Algeria, Togo, Madagascar and Sudan.
|
COUNTRY |
INCOME LEVEL* |
AFRICA RANK |
GLOBAL RANK |
INCOME RANK |
|
Mauritius |
UM |
1 |
53 |
12 |
|
South Africa |
UM |
2 |
58 |
16 |
|
Tunisia |
UM |
3 |
70 |
25 |
|
Uganda |
LI |
4 |
89 |
1 |
|
Botswana |
UM |
5 |
91 |
33 |
|
Morocco |
LM |
6 |
92 |
13 |
|
Ghana |
LM |
7 |
94 |
15 |
|
Senegal |
LM |
8 |
96 |
17 |
|
Kenya |
LI |
9 |
99 |
2 |
|
Cape Verde |
LM |
10 |
103 |
22 |
|
Swaziland |
LM |
11 |
104 |
23 |
|
Mali |
LI |
12 |
106 |
4 |
|
Egypt |
LM |
13 |
108 |
25 |
|
Namibia |
UM |
14 |
109 |
35 |
|
Gabon |
UM |
15 |
111 |
36 |
|
Rwanda |
LI |
16 |
112 |
6 |
|
Burkina Faso |
LI |
17 |
116 |
7 |
|
Zambia |
LM |
18 |
118 |
27 |
|
Malawi |
LI |
19 |
119 |
9 |
|
Nigeria |
LM |
20 |
120 |
28 |
|
Mozambique |
LI |
21 |
121 |
10 |
|
Gambia |
LI |
22 |
122 |
11 |
|
Tanzania |
LI |
23 |
123 |
12 |
|
Lesotho |
LM |
24 |
124 |
29 |
|
Cameroon |
LM |
25 |
125 |
30 |
World Bank Income Group Classifications: LI = Low Income; LM = Lower-Middle Income; UM = Upper-Middle Income


