Despite relatively low capitalization, Africa’s equity markets are building a notable presence in globally recognized indices used by investors and portfolio managers to measure frontier market performance.
African equities are now included in emerging frontier indices and Africa-focused benchmark indices, such as the Russell Frontier Index (RFI), MSCI Emerging Frontier Markets Africa (excluding South Africa) Index, S&P Africa Frontier, S&P Pan Africa, and FTSE ASEA Pan Africa Index.
In an in-depth report on the subject, ACM-Insight, a publication of Applied Capital Markets Ltd., says that at 14.5 percent, African frontier equity markets currently exceed their European and American counterparts by market capitalization in the RFI.
Moreover, African equity markets have seen a surge in Africa-focused equity funds, such as JPMorgan’s Africa Equity Fund and Old Mutual African Frontiers Fund, which invest directly in equity and equity-related securities of companies domiciled or listed on an exchange in Africa. The number of Africa-focused exchange traded funds, or EFTs, also is increasing. These are investment funds that are traded on stock exchanges.
Africa’s equity markets generally are small compared to those in more developed regions, with most of them capitalized below $50 billion and with fewer than 10 listings in some cases. Still, African markets are seeing rapid growth, and the more prominent exchanges are using software systems to boost efficiency and operating speed and reduce costs.
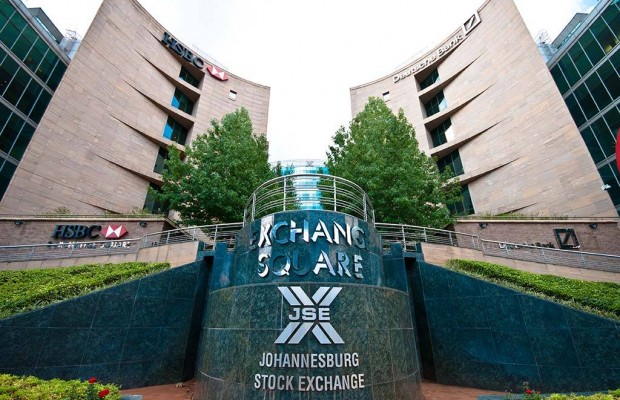
As of September 2013, the total capitalization of Africa’s equity markets was around US$1.5 trillion, up from $113 billion in 1992 and $2 trillion in 2007. At $970 billion, or 63 percent, and 388 listings, South Africa is the biggest market, with Namibia next at $137 billion in capitalization alone, followed by Nigeria at $114 billion. Rounding out the top five in terms of capitalization are Morocco at $55 billion and Egypt, Africa’s oldest exchange, at $54 billion. South Africa, Egypt, Nigeria, Morocco and Kenya account for 96 percent of average daily trade, of which South Africa represents almost 75 percent,.
The attractiveness of African equity markets can be attributed to the continent’s fast-paced economic growth and development, buttressed by political stability, stabilizing and growth-oriented policies and initiatives, liberalized business environments, increasing regional collaboration, and positive engagement with multilateral agencies.
But much more needs to be done to improve liquidity and attract more company listings. Key steps include promoting transparent and accountable institutions, providing adequate shareholder protection and investor education, strengthening regional collaboration, and encouraging financial innovation. Governments should continue to support the exchanges by privatizing public enterprises via exchanges, “and by providing an enabled environment, including tax incentives to encourage listing of multinationals, foreign companies and small and medium-size enterprises.”
Read more at ACM-Insight.
|
COUNTRY |
MARKET CAPITALIZATION 2012 |
MARKET CAPITALIZATION AS OF SEP. 2013 |
NO. OF LISTINGS |
|
Botswana |
$53.0 billion |
$54.1 billion |
37 |
|
BVRM (serving Benin, Burkina Faso, Cote d’Ivoire, Guinea Bissau, Mali, Niger, Senegal & Togo) |
$8.1 billion |
$10.5 billion |
72 |
|
Cape Verde |
$0.1 billion |
$0.6 billion |
4 |
|
Cameroon |
$0.4 billion |
$0.2 billion |
6 |
|
Egypt |
$60.1 billion |
$54.3 billion |
232 |
|
Ghana |
$30.5 billion |
$28.2 billion |
34 |
|
Kenya |
$15.9 billion |
$20.6 billion |
61 |
|
Malawi |
$10.6 billion |
$13.0 billion |
14 |
|
Mauritius |
$7.1 billion |
$8.5 billion |
91 |
|
Morocco |
$52.8 billion |
$54.8 billion |
75 |
|
Mozambique |
$1.0 billion |
$1.0 billion |
3 |
|
Namibia |
$144.2 billion |
$136.9 billion |
34 |
|
Nigeria |
$57.8 billion |
$114.2 billion |
190 |
|
Rwanda |
$1.7 billion |
$1.9 billion |
4 |
|
Sierra Leone |
$0.0 billion |
$0.0 billion |
2 |
|
South Africa |
$998.3 billion |
$970.5 billion |
388 |
|
Sudan |
$2.2 billion |
$1.8 billion |
59 |
|
Tanzania |
$8.4 billion |
$14.8 billion |
7 |
|
Tunisia |
$8.9 billion |
$8.6 billion |
55 |
|
Uganda |
$5.9 billion |
$8.3 billion |
15 |
|
Zambia |
$9.4 billion |
$10.2 billion |
22 |
|
Zimbabwe |
$4.0 billion |
$5.4 billion |
69 |
Source: ACM-Insight


